Exploring the Cost of Solar Energy
What
Does Regular Electricity Cost?
|
2018 US Electricity Prices per kWh |
|
|
Residential |
12.89¢ |
|
Commercial |
10.44¢ |
|
Industrial |
6.58¢ |
|
Tranportation |
9.53¢ |
|
All Sectors |
10.23¢ |
Commercial was up 2.5% from 2017, industrial was up 0.2%, and transportation was up 2.3%.
All sectors were up 0.8% from 2017.
The pie chart at the right shows the approximate
make up of US electricity prices (data from 2015). 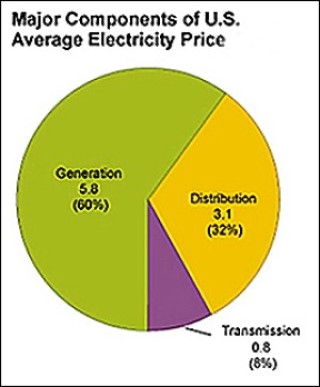 Electricity prices vary by location due to
type of power plants, cost of fuels, fuel transportation costs and state
pricing regulations. The states with the highest average residential price of
electricity in April 2018 were:
-
Hawaii (31.21¢ per kWh)
-
Massachusetts (22.34¢ per kWh)
-
Alaska (21.61¢ per kWh)
Those with the lowest average prices in April 2018 were:
-
Washington (9.74¢ per kWh)
-
Louisiana (9.80¢ per kWh)
-
Arkansas (10.00¢ per kWh)
2018 residential electricity prices were
highest in Hawaii, 31.21¢ per kilo-watt hour (kWh), because most of their
electricity is generated using crude oil.. The lowest price was in the state of
Washington with 9.74¢ per kWh.
In 2016 (latest data available) the US
average residential household used 897 kWh per month and the average monthly
electricity bill was $112.59 before taxes and fees. Prices are higher for
residential and commercial customers than industrial customers because it costs
more to distribute the electricity and step the voltages down. Industrial
customers use more and can take their electricity at higher voltages so it does
not need to be stepped down. These factors make the price of power to
industrial customers close to the wholesale price of electricity (the price
from one utility to another).
What
Does Solar Electricity Cost?

As shown in the chart at the right, photovoltaic (PV) solar cell prices have come down by a factor of 100 over the last 38 years; and down by a factor of 25 over the last 15 years. (The reason for the small increase between 2005 and 2008 was because of a polysilicon shortage.) The sharp drop in 2009 and 2010 was because of too much capacity, especially in China, which has caused prices to collapse. The 2015 average solar "cell" price was $0.30 per watt and the average solar "module" price was $0.72 per watt.
Since costs after installation are minimal for solar electricity, the relevant costs are the purchase price, installation costs, and the cost of land (capital costs). Cost components that make up a residential solar system are: system design, solar modules, and the balance of system (BOS) which consists of an inverter, bi-directional billing meter, connection devices, and installation labor. In the southwest, installed residential solar prices are competitive with residential electricity prices after incentives.
According to the National Renewable Energy Laboratory (NREL), located in Golden Colorado and Washington DC, the average residential household in the U.S. installs a 5 kWh system and during 2017, it cost on average $2.80 per DC watt or $14,000 (5000 times $2.80) before incentives. Utilities on the other hand typically install systems in the 100 mega-watt or greater range. The average installed "fixed" solar panel system cost during 2017 was $1.03 per watt.
Why
did PV Prices Come Down So Rapidly?
 As can be seen from the graph at the right,
recent solar module prices have experienced a dramatic price reduction. From
2007 to 2014, a seven year span, worldwide average module prices dropped about
78% from $3.25 per watt to about $.72 per watt, an phenomenal drop.
The main reason crystalline silicon module prices dropped so much was because the price of the raw material polysilicon, which makes up a very significant part of the total cost, dropped so tremendously. Back in 2007 there was a world wide polysilicon shortage and prices increased to about $400/kg. Polysilicon suppliers made a lot of money and added tons of capacity so that there was a huge polysilicon capacity oversupply by 2010. Over a three year period from 2008 to 2011, polysilicon prices dropped from $400 per kilogram to $25/kg - a 94% drop.
In addition to the polysilicon issue, the decline is also being driven by a) the increasing efficiency of solar cells (ratio of electrical energy produced to sunshine energy) b) dramatic manufacturing technology improvements, c) economies of scale and d) intense competition which leads to module oversupply.
The solar growth rate of 23% per year over the last few years allowed manufacturing efficiencies that are unheard of in other industries. In addition, there are too many competitors jousting for major contracts, which is driving prices down precipitously.
When Will PV Solar Reach Grid Parity?
 There is no one cost number that defines
utility grid parity. There are different levels of parity depending on what the
generation system is. Solar has already penetrated the most expensive generator
- the "peaking plant", also known as a "peaker". Peakers
are rather small plants, ranging from 50 MW to 500 MW in size, normally about
100 MW. Peakers are mainly used in the summertime during "peak"
electrical use for air conditioning late in the afternoon. They are normally
single-cycle natural gas generators, meaning no boiling water; burning natural
gas directly fuels the turbine. Peakers have to be able to come up to speed on
10 to 15 minutes notice. They are very inefficient and expensive to run, but
are great sources of electricity when utilities are on the verge of rolling
blackouts. At that point, operating expenses are down the list of priorities.
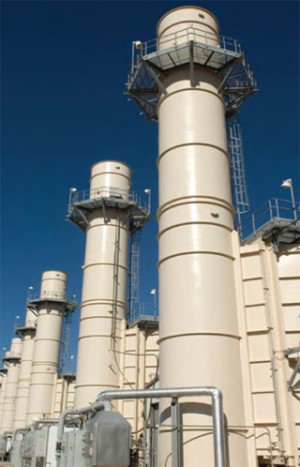
Shown at the right is a photo of APS's Sundance Peaker plant near Coolidge, AZ. The site consists of ten generators, and all ten can be on the grid within 10 minutes generating 450 MW of power. Each generator consists of a converted GE Boeing 747 jet engine powered with natural gas which can be turned on with a click of a mouse and will generate 45 MW of power.
The next level of power plant available are the "load following" plants. These are intermediate size plants that are normally turned off at night but follow the increasing electrical load as the day progresses. These are generally combined-cycle plants (natural gas with a steam turbine) that are expensive but easy to turn on and off.
Finally, you have the huge "base load" plants that are operated continuously day and night except for maintenance down time. These are nuclear and coal type plants that are very efficient but can take many hours or even days, in the case of nuclear, to come up to speed and to shut down. They are the backbone of the electrical industry and will remain so for the foreseeable future.
So how big is the Peaker electricity market? The total US electricity market in 2017 was 4,015 million kilo-watt hours (m-kWh) according to the February 2018 EIA Report (which includes the whole year for 2017). The peaker portion is generally accepted to be 5% of the total market. So, 5% of the total is 201 m-kWh. The total amount of PV generated electricity in the US in 2017 was 73.8 m-kWh (1.8% of the US total), also from the February EIA Report. This is only 37% of the peaker market. So, there is plenty of "peaker" market yet available for solar in the US in addition to some of the "load following" plant market.
In October 2017 California Governor, Jerry Brown, signed a state bill mandating that utilities meet their peak energy and reliability needs with alternatives to fossil-fuel generating plants while also providing the electricity at the lowest cost to consumers. Unless there are unusual circumstances, there most likely will be no more gas peakers approved anywhere else in the US for meeting summer peak demand.
PV
Solar Parity Has Begun
Levelized Cost of Energy (LCOE) - PV Solar
Cheaper than Coal and Nuclear
The following table shows the Levelized Cost of Energy (LCOE) for various sources of electricity. LCOE is a "fair" method of comparing the cost of different complex energy technologies. It is the total life cycle cost of electricity for a given technology divided by the total life cycle electricity produced, expressed as dollars per million-watt hours ($ per MWh). The table below, derived from LCOE costs developed by the US Energy Information Administration (EIA) in March, 2018, "estimates" the average LCOE (with no subsidies) over a 30-year period for different energy sources that are brought online in the year 2022. The year 2022 is used for comparison as that is a realistic time frame for a new plant to come on-line. (LCOE calculations are explained in much more detail in the Utility Section below.)
Notes: CCS stands for Carbon Control and
Storage (Sequestration) in a remote underground location.
Energy Plant Type
Lifetime Cost $ per MWh
Offshore Wind
138.0
Coal with 30% CCS
130.1
Coal with 90% CCS
119.1
Biomass
95.3
Advanced Nuclear
92.6
Nat Gas Combined Cycle with CCS
74.9
PV Solar
63.2
Hydro-electric
61.7
Land Based Wind
59.1
Natural Gas Combined Cycle
50.1
Geothermal
44.6
"New" conventional coal plants
without CCS and "new" Peaker Natural Gas plants are not allowed in
the year 2022.
PV solar is much cheaper than coal with CCS (about half) and it is unlikely that any new coal fired plants will be built in the US. The Petra Nova facility, a coal-fired power plant located near Houston, Texas, is one of only two operating power plants with carbon capture and storage (CCS) in the world. It is the only CCS facility in the United States. So, CCS of any kind is not currently a major competitor to solar. Solar costs have been coming down dramatically. They are expected to slow down somewhat, but will continue to decline from the levels used in the LCOE calculations above.
Nuclear has many sideline issues besides
cost and therefore very few new nuclear facilities are expected. Geothermal,
hydro-electric, and biomass are not mainstream electrical production
facilities, a few here and there. Therefore, as far as new electrical
facilities are concerned, natural gas without CSS, land-based wind and solar
will be the main new contributors. Wind is limited as an average daily rate of
20 miles per hour (mph) is needed to be economically feasible. Not many areas
average 20 mph winds every day. However, the sun shines almost everywhere,
making solar an almost universal candidate. Therefore, natural gas and solar
will be the main sources of new energy production.
A
Simple Chart Delivers the Message
A November 2017 report from Lazard shows
how the costs of producing electricity from various sources are changing.
Energy from utility-scale solar plants that feed into the grid has seen the
biggest price drop - an 86% decrease since 2009. The cost of producing one
megawatt-hour of electricity, a standard way to measure electricity production,
is now around $50 for solar power, according to Lazard's math. The cost of
producing one megawatt-hour of electricity from coal, by comparison, is $102 -
more than double the cost of solar.
The rapidly declining cost of solar is a
sign that the world is most likely on the verge of a dramatic change in how our
buildings and vehicles are powered. This price drop is likely to spur a shift
towards renewable power like solar and wind, and away from fossil fuels like
oil and coal.
How
Much Solar Power Is Reasonable?
When we say that PV will eventually be at parity with natural gas and coal, that does not mean there will not be any coal or natural gas generators thereafter. Because the sun shines only during daylight hours, and wind is most prevalent at night, both are variable. We cannot be totally dependent on renewables in the foreseeable future. Currently, wind provides 4% and solar about 2% of US electricity. An electrical generation target of 20% solar and wind by 2040 seems reasonable. (For reference, 20% of US electricity is the equivalent of the energy used in "all" the cars and light trucks in the US.) The solar and wind figures could be larger if there were some "dramatic cost improvements" in grid electricity storage, notably large battery systems. However, at the moment, large battery storage at the grid level still looks a way off.
In addition, more than 20% of solar and
wind would require major investments in transmission lines. Not only are
transmission lines expensive, but they are hard to permit because of the NIMBY
(not-in-my-back-yard) factor. Transmission lines also require three to four
years to build, versus solar or wind plants which can be easily built in two
years. If by 2040, 20% of our electricity comes from solar and wind, almost
everyone will be happy with the situation.
Long
Run Solar Cost
 "Most cost analyses are run over a 20-
or 30-year period." Ken Zweibel of George Washington University said.
"That is not the correct way to evaluate long life assets like PV systems,
nuclear plants, or other large long-lasting utilities. PV systems can last
maybe up to 100 years!" There is only a small degradation of performance -
about a half of one percent per year. So, a PV system after 50 years will still
produce electricity at 75% of its original performance. 50 years is perhaps a
better time frame over which to evaluate the cost of this type of asset. The
graph on the right for100 years is very interesting.
Once installed, PV systems need very little maintenance so that the total lifetime cost is mostly just the initial price of the equipment and land. This is conceptually how we think of an investment in bridges or roads. The chart at the right uses a weighted average (weighted by annual output performance) for the cost for the current year plus all previous years for each data point. Once the initial cost of the system is paid for (assumed to be 20 years) the cost of running a PV system is almost zero, whereas for coal and other fossil fuels there is the cost of fuel each and every year. In addition, costs for fossil fuels may creep up due to raw material costs, shipping costs, and possibly carbon dioxide taxes.
At an installed price of $1.25 per watt per
the above analysis, the cost of PV solar is always cheaper than coal. Per the
NREL, the cost of utility solar was $1.03 per watt in 2017 (from the table at
the top of this page). So, in 2017, utility solar became cheaper than coal and
advanced nuclear. As a result, no "new" coal or nuclear plants are
expected to be initiated. However, some current coal and nuclear plants will
likely be upgraded.
Solar
Learning Curves
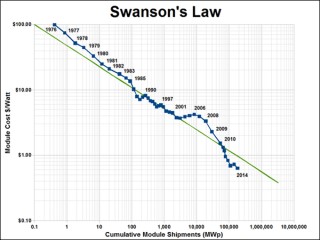 Swanson's law is the observation that the
price of solar photovoltaic modules drops about 20 percent for every doubling
of cumulative shipped volume. It is named after Dick Swanson, the founder of
SunPower Corporation, a solar panel manufacturer. (Swanson's law has been
compared to Moore's law, which predicts the computing power of
micro-processors.)
Crystalline silicon photovoltaic cell prices have fallen from $76.67 per watt in 1977 to about $0.60 per watt in 2014. Plotting the module price (in $/Watt) versus time shows a drop of about 10% per year.
Swanson's Law appears to have originated
with an article in The Economist published in late 2012. However, Dick Swanson
said in a Greentech article in 2017, "I didn't invent it. Over the years,
my name has become linked with the experience curve in solar. This is a
complete misnomer. Greentech has graciously offered me a pulpit to set this
right."
Cadmium Telluride Vs. Crystalline Silicone
As shown in the learning curve chart below,
cadmium telluride thin film panels are inherently cheaper to make than crystalline
silicone panels. These classical learning curves plot "module cost"
on the Y axis vs. "cumulative quantity" produced on the X axis. Both
axes are logarithmic scales. The chart shows that the two technologies are on
distinctly different curves, not dependent on time but on volume. Although
crystalline silicone is inherently more expensive, its production volume is
much, much larger than cadmium telluride. Just looking at the curves, one would
expect crystalline silicone to equal cadmium telluride in the near future.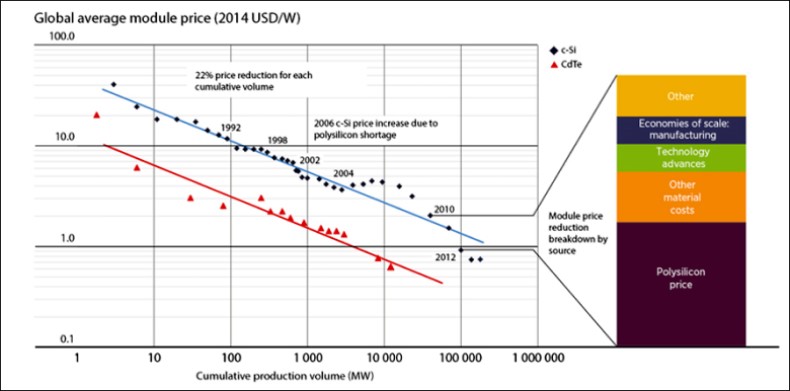
However, the extreme polysilicon price
decline is most likely in the past and future price reductions will probably be
more modest. Note that the last two points for crystalline silicone are equal
(no reduction). Most analysts believe First Solar, the leader in cadmium
telluride, will continue to drive costs down. First Solar no longer shares
their cost goals with the public and most crystalline silicon manufacturers
have followed suit. However, First Solar did announce that they beat their cost
goal during 2017 (speculated to be $.40 per watt). In the long run, the race
between cadmium telluride and crystalline silicon will continue to be a
critical cost reduction race as crystalline silicone's volume is roughly 14 to
1 over cadmium telluride.
Residential
Cost Example - Typical Southwest House
A roof top solar system has no moving parts, so it has a long-expected lifetime exceeding 25 years (used in this example). However, inverters (which convert the panel DC current into AC) have an expected lifetime of 10 to 15 years. In our example we add the cost of a replacement inverter to the system after 12 years. We assume no other maintenance costs as the panels are usually warranted for 25 years with a degradation clause. So, let us calculate a south facing roof top residential cost example in the southwest United States in Q1 2018:
- Residential house - Phoenix metropolitan area
- Electricity provider - AZ Public Service Corp. (APS)
- Average system size - 5 kW (5,000 watts)
- Roof space required - 500 square feet, no shading
- Phoenix cost per installed watt in Q1 2018 ~ $3.00
- System fully loaded cost at $3.00/watt - $15,000 before incentives
- Federal tax incentive 30% of total cost - ($4,500)
- AZ State tax credit - ($1,000)
- Sum of incentives - ($5,500)
- Initial net cost to consumer - $9,500
- Add replacement inverter in 12 years - $1,410 ($2,565 in 2018 less ~5% per year decrease)
- 25-year total system cost - $10,910
- Estimated monthly savings - $84/month average over 25 years
- Break even - 130 months (10.8 years)
- Net savings over 25 years - $14,280 (170 x $84, excluding inflation)
- Net savings over 25 years - $17,850 ($14,280 x 1.25, assuming 2%/yr. inflation)
Note: The above calculations are approximate and for illustration purposes only. Actual costs will depend on the exact location of the home, the angle to the sun (north-south vs. east-west), the amount of shade if any, the type and angle of roof, electrical connections, additional options, etc. For an accurate estimate, please contact a local solar installation contractor and your tax accountant.
Monthly Savings Calculation: A south facing
roof top solar system with no shading, and with a normal yearly dessert
sunlight radiance of 2,400 per square meter would produce 1,840 kWh of
electricity per year per nameplate kW capacity (assuming 23.3% losses for DC to
AC conversion and other system losses). With a 5-kW system installed, the first-year
production would be 9,200 kWh (5 x 1,840). Assuming an average system
degradation of 0.5% per year times 25 years yields a net 8,050 kWh yearly
average electricity savings (9,200 x .875). Assuming an average 2017
residential electricity price in AZ of $.125 per kWh (excluding taxes and fees)
yields a yearly savings of $1,006.25 (8,050 x $.125 not counting future
inflation). The monthly savings would then be $83.85 ($1,006.25 divided by 12).
This was rounded to $84.00 even.
Utility
Cost of Electricity
The cost calculations for a utility
installation are quite complex. In principle they are simple:
Where: LCOE is the Levelized Cost of Electricity. The LCOE approach allows different technologies to be compared, not only solar approaches, but fossil fuels and nuclear as well. The Total Life Cycle Cost is the present value of all the components of cost over the useful life of the installation minus the depreciation tax benefit and residual value. The Total Lifetime Energy Production is all the useful energy produced by the installation over its total life.
Total Life Cycle Cost Components for Solar Electricity
- Initial capital investment
The cost of all the equipment involved in the projectLand related costs which depend on the number of panels, site preparation and security protection.
Grid connection costs such as inverters, transformers, and transmission to the nearest grid.
Interest at 6%. All capital costs are assumed to be financed by obtaining a loan (for LCOE purposes only).
(Note: The above costs are very sensitive to panel efficiency. Panels that are 12% efficient versus those that are 18% will need 50% more panels, 50% more inverters, 50% more land, etc.)
- Initial Labor Cost
Site design, installation labor, sales and marketing, and other overhead expenses.
- Annual Costs
Operating costs, maintenance costs, panel cleaning, insurance, and general overhead are included.
- Depreciation
The present value of the depreciation tax benefit is subtracted.
- Residual Value
The present value of the residual price at the end of the project’s life is also subtracted.
Total Lifetime Solar Energy Production
The value of the electricity produced over the total life cycle of the system is calculated by estimating the initial annual production, called Peak Capacity, and then discounting it for future years based on previously observed annual degradation rates for the particular technology of the site. A typical degradation rate is 0.5% per year, although some rates are as high as 1.0% and as low as 0.25%. The first-year energy production of the system is expressed in kilowatt hours generated per kilowatt of peak capacity.
Factors Affecting Peak Capacity:
- How the system is mounted and oriented (i.e. flat, fixed tilt, tracking, etc.)
- The spacing between PV panels as expressed in terms of system ground coverage ratio (GCR)
- The energy harvest of the PV panels (i.e. performance sensitivity to high temperatures, sensitivity to low diffuse light, etc.)
- System losses from soiling, transformers, inverters and wiring inefficiencies
- System availability largely driven by inverter downtime
Post a Comment:
You may also like:
