Understanding and Managing Solar Storms
What are Solar Storms?
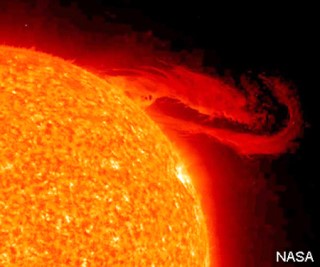 The sun periodically emits a prominence on
its surface, a distinctive looking figure that is in its outer atmosphere, the
Corona, and many times has a swirl or loop configuration. A prominence is a
mass of plasma gases and charged particles that are cooler (60,000 degrees C)
than their surroundings (a million degrees C). A typical prominence is a
billion tons or more of these gases supported by huge magnetic forces.
Some prominences break apart and morph into Coronal Mass Ejections (CMEs) that are propelled into outer space at a million miles per hour. The CME on the left erupted from the sun during September, 2008. Solar flares can also morph into CMEs. And, some CMEs form on their own without either flares or prominences.
The relationship between prominences, flares and CMEs is not well understood. In addition, they are not predictable as the trigger mechanisms are also not understood. Considering that the sun itself is rotating, a small number of CMEs have a trajectory that will intersect the earth in its orbit around the sun. This earth directed CMEs are called "Solar Storms".
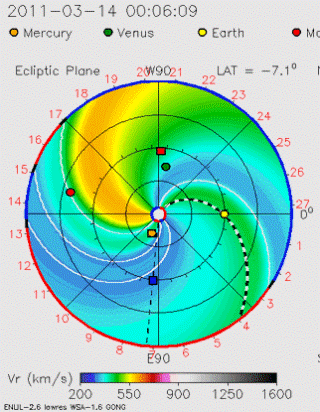 Shown at the right is an actual
animation of the sun and surrounding space from March 14, 2011 to March 27,
2011. In the middle is the sun with the earth the yellow circle at 0 degrees on
the right. The sweeping yellow and green swaths are the normal bursts of plasma
particles from the sun that we call the solar wind. Their circular motion
results from the rotation of the sun which is roughly every 27 days. There is a
CME on March 18th that is a strong one (colors red, purple and black) but it
flies off to the southwest and is in no danger of hitting the earth.
When the magnetic field of a CME interacts with earth's magnetic field, there is an induced magnetic reaction. If the CME is a mild one, as most are, we see the reaction as a strong aurora in the skies near the north pole which we would term an extended "northern lights" show.
However, during severe solar storms, enormous amounts of energy are transferred to earth's Magnetosphere through a process called Magnetic Reconnection. Huge "Geo-magnetically Induced Currents" (GICs) are produced which run through the earth's crust surface and then upwards through the "grounding" wires of the grid.
Magnetic Reconnection is a physical process in the highly conductive gases of the upper atmosphere when magnetic fields clash and then restructure themselves into a lower energy level configuration. The excess magnetic energy is converted into electrical currents in the ground and the grid. Thus, our power grids have become giant antennas for GICs.
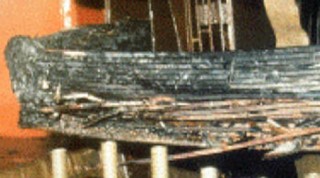
These massive currents can melt giant grid transformers. This actually happened in 1989 damaging transformers in New Jersey at a nuclear power plant (shown on the right below) and Canada. These huge transformers can take up to a year to repair or replace. Although the above storms did some local damage, relatively speaking the damage was contained and not widespread.
 About once every 500 years, a humongous CME
can hit the earth. One such storm hit in 1859, known as the Carrington Storm,
named after Richard Carrington, a prominent English astronomer who observed it.
It was the first solar storm ever recorded. Stunning auroras pulsated as far
south as Cuba, El Salvador, and Hawaii.
Telegraph systems worldwide went haywire. Spark discharges shocked telegraph operators and set the telegraph paper on fire. If such a disastrous monster storm should hit today, experts tell us that the grid damage would be devastating - the equivalent of 20 times Katrina. Consumer electricity on a wide scale could be shut down for months. It is hard to imagine all the consequences of such an event.
In addition to grid transformers, satellites are also subject to solar storms. There are over 900 operating satellites in space and all are vulnerable to solar storms, especially communications satellites.
Forecasting Storms
 SWPC - In the United States, the main
source of space weather information is the Space Weather Prediction Center
(SWPC) located in Boulder, Colorado. SWPC is the service center of the National
Oceanic and Atmospheric Administration’s (NOAA's) National Weather Service. The
SWPC provides forecasting information for solar storms and also monitors events
once a storm hits the earth's atmosphere.
SWPC scientists incorporate satellite-based sensor data, as well as data from optical observatories around the world. SWPC forecasts space weather on time scales of hours to days by analyzing current conditions, comparing current conditions to past conditions, and using forecasting models.
Solar Shield is a solar storm forecasting system for the North American power grid developed by NASA and EPRI (Electric Power Research Institute) to forecast solar storms with enough warning to give utilities time to react. The goal of the project is to develop a forecasting system that can help mitigate damages from GIC currents on high voltage transmission systems.
Solar Shield uses mathematical models based on data retrieved from space satellite readings from the sun's flare explosions and from earth-orbit satellite-based sensors as the storms pass by. The first calculation is whether or not a fast flying solar storm is likely to intersect the moving earth in its orbit around the sun. The size, speed, timing, strength and exact direction of the storm are also critical first estimates. Most storms just fly off into outer space, only 1% affect the earth.
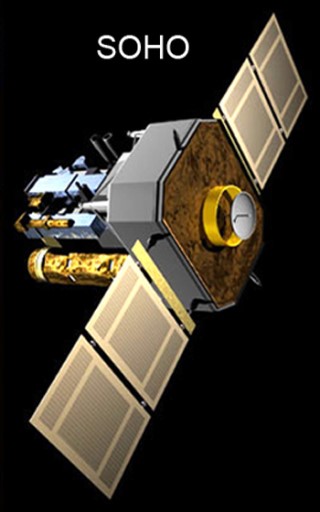
SWPC uses several satellites to monitor solar events. Launched in 1995, SOHO, shown at the right, currently operates at the L1 Lagrange Point, which is the point between the sun and the earth where the gravitational pull from the two bodies counter balance about 1 million miles from earth. There is a total of 5 Lagrange Points (L1 through L5).
SOHO's mission is to study the sun from deep in its core to the outer Corona. SOHO provides "magnetograms" and CME observations on the sun's surface which are used for the two-day SWPC forecasts. Originally intended to operate for only two years, it has greatly exceeded its life expectation and is currently approved to operate through the end of 2012.
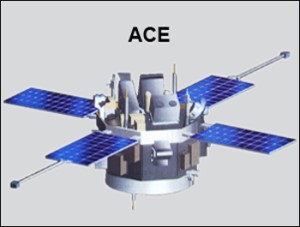 Launched in 1997 ACE, pictured at the right,
also currently operates close to the L1 Lagrange Point. Its mission is to study
energetic particles from the solar wind and storms as they pass by. It has
sufficient propellant to operate until approximately 2024. Over time these
satellites drift and periodically they must be re-positioned at the L1 Lagrange
Point using stored fuel. However, ACE's instruments are now outdated and the
government is attempting to get funding for a replacement satellite called
DSCOVR.
Solar Shield is divided into two sections - Level 1 and Lever 2. Using input from SOHO as the storm leaves the sun, the Level 1 software produces a three-dimensional model of the CME and then predicts when it will strike the earth, if at all. Level 1 makes a probabilistic forecast of specific nodes (transformers) of the grid that are likely to be affected by GICs one to two days in advance.
Level 2 makes a deterministic forecast of affected transformers using ACE measured data as the storm passes the L1 Lagrange Point an hour or so before the storm hits the earth's magnetosphere.
 Level 1 makes a probabilistic forecast of
specific nodes (transformers) of the grid that are likely to be affected by
GICs one to two days in advance. Level 2 makes a deterministic forecast of
affected transformers using ACE measured data as the storm passes the L1
Lagrange Point an hour or so before the storm hits the earth's magnetosphere.
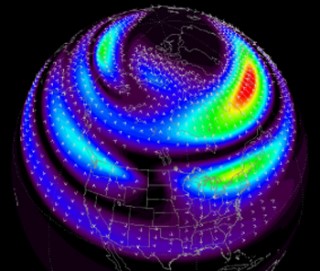
ACE will measure the actual CME's speed, density and magnetic field. Since the storm travels approximately one million miles per hour and ACE is about one million miles away, the lead time of the forecast is only 40 to 60 minutes. But, this is enough time for grid system operators to take some types of action. Both of these computer forecasts are fed into the SWPC center as well as into EPRI's Sunburst Network. The map at the right shows GIC ground current directions (small arrows) and intensity (by color, red is most intense) from a storm of April 5th, 1998.
At this time (December, 2011) Level 2 can only make reliable forecasts for nodes above 60 degrees latitude. The only US major city at that latitude is Anchorage, Alaska which is at 61 degrees. Since 95% of Canadians live within 100 miles of the US border, most of Canada is also excluded. NASA and EPRI are requesting funding to enhance Level 2 to cover latitudes from 40 degrees to 60 degrees. For a mental picture of where a 40-degree latitude line would be, New York City is at 40 degrees, Chicago is 41, Denver is 39, and Sacramento, California is 38. Forecasts for locations north of 40 degrees would cover most of the areas likely to suffer "damage" from a major solar storm.
Operational Guidelines
SWPC categorizes solar storms on a K-scale that ranges from 1 to 9. The actual index used is an average of a number of monitoring points. When the SWPC forecasts a storm greater than Kp 6, operators swing into action.
The chart is an actual Solar
Shield screen in the middle of a solar storm. The left-hand side shows the
Level 1 Solar Shield four data fields (forecasted start time, forecasted end
time, range of currents, and the time stamp of the forecast). The graphic on
the right of the screen shows how the Level 2 forecast compares to the observed
GIC up to the “now” line, and then shows the forecast only to the right. As one
can see, although the timing is slightly off, the DC neutral current
"range", which is of the most interest, is almost bang on.

Actions an operator can take after a warning but before a storm actually hits are:
- Actions an operator (or Reliability Co-Ordinator) can take in the middle of a storm are:Discontinue non-critical maintenance work.
- Restore out-of-service transmission lines if possible.
- Reduce loading on high voltage transmission lines to 90% of normal.
- Bring standby generators on line.
- Monitor key lines and transformers with increased vigilance.
Actions an operator (or Reliability Co-Ordinator) can take in the middle of a storm are:
- Increase "reactive" reserves (generators, capacitor banks, static VAR compensators, etc.).
- Reduce and maintain system voltages in acceptable ranges.
- Decrease loading on susceptible transformers if possible.
- Re-dispatch electrical generation if possible.
- As a last resort, remove affected transmission equipment from service if excessive GICs are measured or unusual equipment behavior is experienced.
Forecasting Tool: WSA-Enlil

Above is a computer screen displaying predictions. The top row plots show predictions of the solar wind density. The bottom row plots show solar wind velocity. The circular plots on the left are a view from above the north pole of the sun and earth, as if looking down from above. The sun is the yellow dot in the center and the earth is the green dot on the right. Also shown are the locations of the two NASA STEREO satellites. The wedge-shaped plots in the center provide a side view, with north at the top and south at the bottom.
The graphs show the model predictions over time for the plasma density and velocity at the earth and the two STEREO spacecraft. The yellow vertical line is in sync with the animations on the left, so it is possible to see how values of density and velocity correspond to various solar wind conditions. In this particular forecast a small CME can be seen striking the earth at about 12 am on June 17, 2012.
Post a Comment:
You may also like:

